Synchronize panels by clicking the panel directional buttons found at the top of the panel.
InputCalcInd2
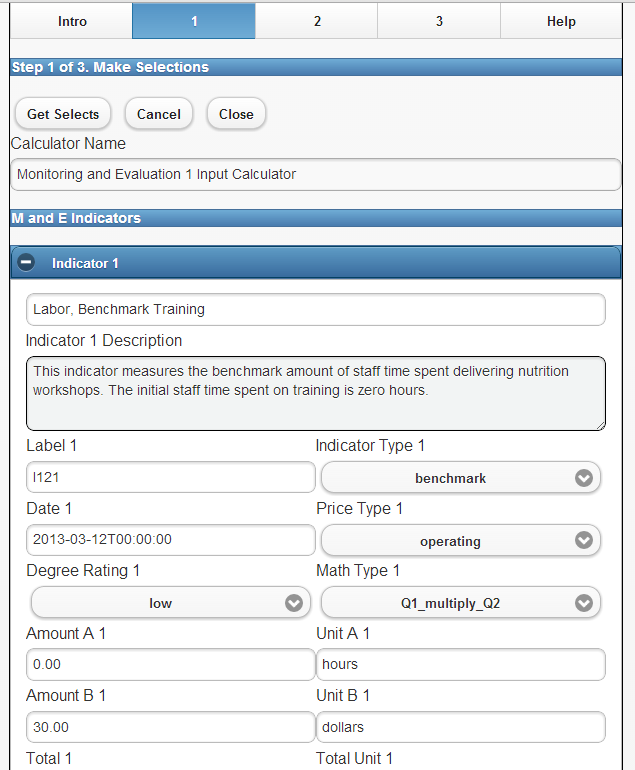
This image shows the properties of M and E calculators.
Tech Story: B Introduction to Malnutrition Project 1
Page 1 of 4. Introduces the malnutrition improvement project and data set that is used in a DevTreks tutorial.
BudgetAnalysisInd1
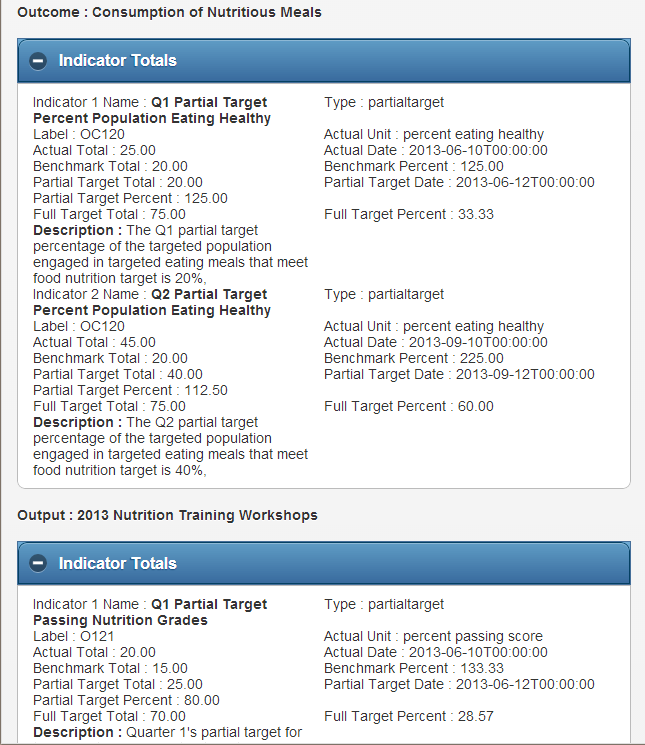
This image displays the results of running a typical monitoring and evaluation analysis.
Tech Story: C Malnutrition Project 1 Analysis
Page 2 of 4. Explains the current results of the monitoring and evaluation analysis.
ME1InvestmentStocks1
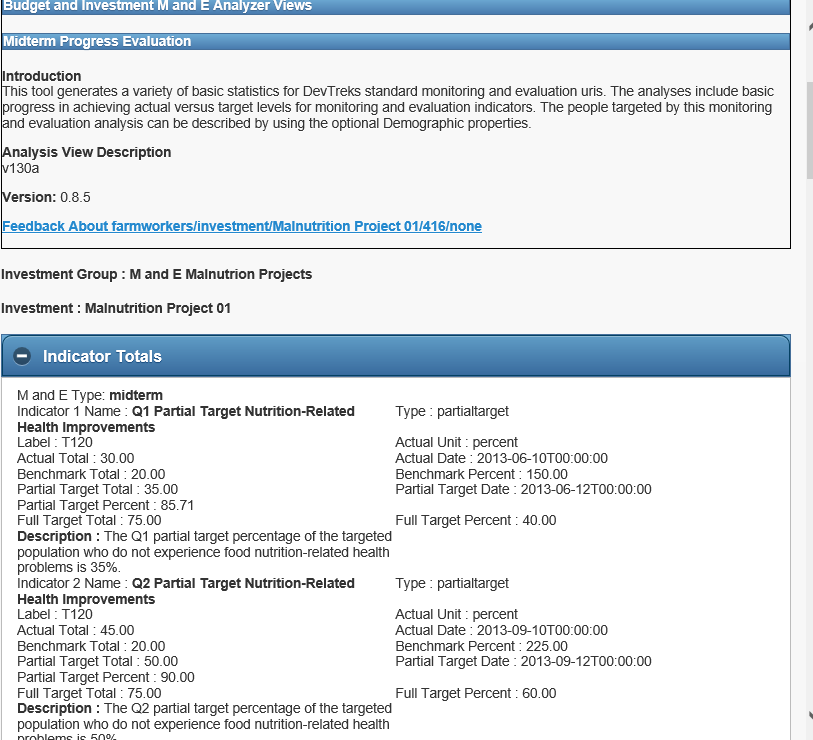
This image displays the sibling monitoring and evaluation analyzer.
Dataset:ME1 Change by Id Analyzer
This analyzer measures changes in monitoring and evaluation indicators.
view IRI
ME1InvestmentStocks1
This image displays the sibling monitoring and evaluation analyzer.
Dataset:ME1 Change by Year Analyzer
This analyzer measures yearly changes in monitoring and evaluation indicators.
view IRI
ME1InvestmentStocks1
This image displays the sibling monitoring and evaluation analyzer.
Dataset:ME1 Stats Analyzer
This analyzer generates statistics for monitoring and evaluation indicators.
view IRI
LorocoPipian

Mixed crop production in El Salvador.
Tech Story: Malnutrition Analysis Introduction
This tutorial explains the importance of cloud computing food nutritional analysis.
DCToDIF
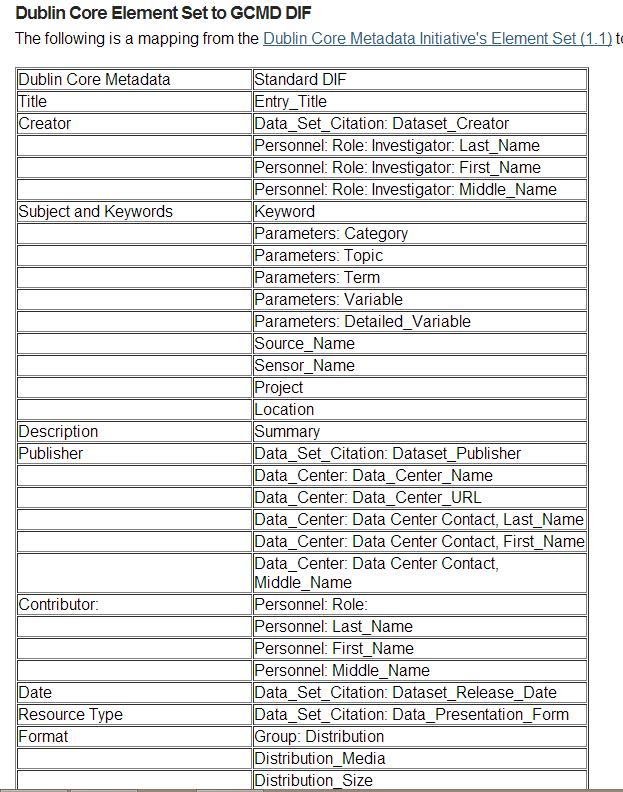
This image demonstrates how Dublin Core metadata elements map to DIF elements.
Tech Story: A Malnutrition Project 01 Metadata
This metadata is used to describe the stories and analyses associated with a malnutrition project.
TotalandMarginalProduct
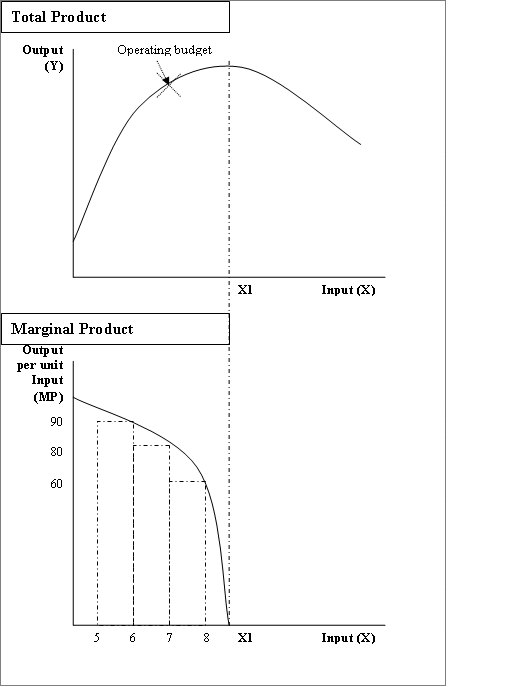
This image displays one of the economic principles underlying budget analysis.
Dataset:NPV Capital Budget Calculator
This calculator carries out net present value calculations of capital budgets.
view IRI